环境信息
启动过程 在 systemd 管理的系统中,提供了工具 systemd-analyze 用于分析具体的启动过程,使用 systemd-analyze --help 查看使用帮助
检查系统启动时间 使用 systemd-analyze 命令会显示系统启动所用的时间,等同于 systemd-analyze time
# systemd-analyze
Startup finished in 1.830s (kernel) + 36.827s (userspace) = 38.657s
graphical.target reached after 12.604s in userspace
systemd-analyze blame 列出系统上各个 Unit 启动的时间
# systemd-analyze blame
          6.414s wazuh-agent.service
          3.161s dracut-initqueue.service
          2.473s network.service
          1.004s watchdog.service
          ...
            45ms sysstat.service
            14ms plymouth-switch-root.service
            14ms systemd-journald.service
             4ms systemd-logind.service
             3ms sys-kernel-config.mount
             3ms initrd-udevadm-cleanup-db.service
             3ms systemd-random-seed.service
             2ms google-shutdown-scripts.service
列出系统各个 Unit 启动消耗的时间
# systemd-analyze critical-chain
The time when unit became active or started is printed after the "@" character.
The time the unit took to start is printed after the "+" character.

graphical.target @12.604s
└─multi-user.target @12.601s
  └─skylight-agent.service @36.639s
    └─network.target @9.073s
      └─NetworkManager.service @8.795s +275ms
        └─dbus.service @8.788s
          └─basic.target @8.774s
            └─sockets.target @8.772s
              └─snapd.socket @8.766s +5ms
                └─sysinit.target @8.669s
                  └─cloud-init.service @6.850s +1.811s
                    └─systemd-networkd-wait-online.service @4.970s +1.871s
                      └─systemd-networkd.service @4.864s +91ms
                        └─network-pre.target @4.850s
                          └─cloud-init-local.service @3.228s +1.620s
                            └─systemd-remount-fs.service @1.113s +93ms
                              └─systemd-fsck-root.service @1.030s +69ms
                                └─systemd-journald.socket @853ms
                                  └─-.mount @692ms
                                    └─-.slice @692ms
查看内存信息 内存相关概念说明:
VSS ,Virtual Set Size , VIRT - 虚拟耗用内存(包含共享库占用的内存), 通常 VIRT 是系统承诺分配给应用的内存,不是实际使用的内存 RSS , Resident Set Size , RES - 实际使用物理内存(包含共享库占用的内存)PSS , Proportional Set Size - 实际使用的物理内存(比例分配共享库占用的内存)。 top 命令中的 SHR 列展示的就是共享库按比例分配给进程的内存USS , Unique Set Size - 进程独自占用的物理内存(不包含共享库占用的内存)
系统内存使用量统计 free $ free -h total used free shared buff/cache available Mem: 15Gi 7.8Gi 707Mi 449Mi 7.0Gi 6.9Gi Swap: 30Gi 1.0Gi 29Gi
ps 例如查看使用内存排名前十的进程:
ps aux | sort -k4,4nr | head -n 10
sar 命令 使用 sar 命令检查系统上的内存及 Swap 使用情况
查看某个进程使用的内存量 比如检查 docker 使用的内存量,首先通过 ps 命令查询到 docker 的 PID 信息
$ ps -elf | grep docker
4 S root      1243     1  4  80   0 - 1067527 futex_ Jan03 ?      15:14:45 /usr/bin/dockerd -H fd:// --containerd=/run/containerd/containerd.sock
例如此处的 docker 进程的 PID 为 1243
sar 命令用法参考 sar(System Activity Reporter)是查看系统上各项活动统计数据的经典工具。他是系统包 sysstat 的一部分,并且依赖于 sysstat.service。
# systemclt enable sysstat
# systemctl start sysstat
要查看 sar 命令用法,请参考 sar --help 或者 man sar
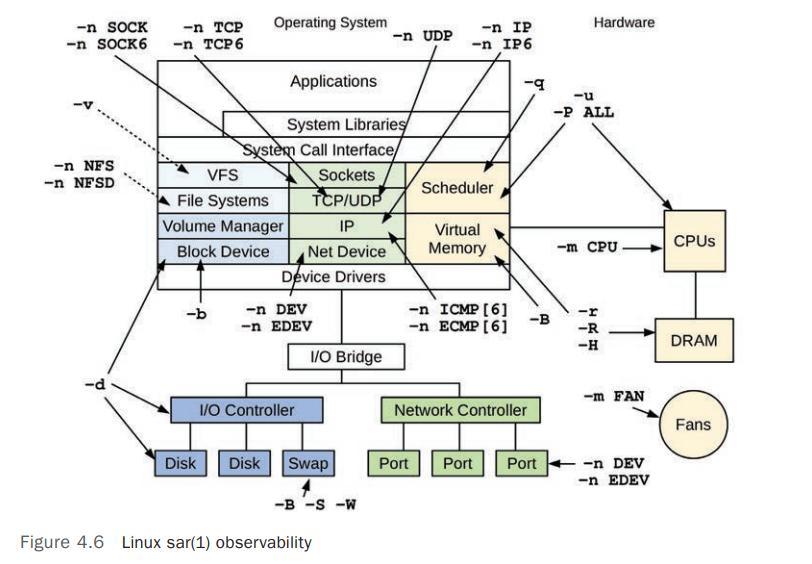
下图列出了 sar 可以观测的各个部分及其命令行选项
sar 采集系统统计数据依赖于 crond 服务,具体配置可以查看 /etc/cron.d/sysstat,默认每 10 分钟归档一次
/etc/cron.d/sysstat # The first element of the path is a directory where the debian-sa1 # script is located PATH=/usr/lib/sysstat:/usr/sbin:/usr/sbin:/usr/bin:/sbin:/bin # Activity reports every 10 minutes everyday 5-55/10 * * * * root command -v debian-sa1 > /dev/null && debian-sa1 1 1 # Additional run at 23:59 to rotate the statistics file 59 23 * * * root command -v debian-sa1 > /dev/null && debian-sa1 60 2
sar 采集的统计数据默认归档于 /var/log/sysstat/ 下。
# ls /var/log/sysstat/sa12 sa13 sa14 sa15 sa16 sa17 sa18 sa19 sa20 sar11 sar12 sar13 sar14 sar15 sar16 sar17 sar18 sar19
sar 用法提示:
sar -A 可以导出所有的统计数据sar 的统计数据支持多种格式。可以使用 sysstat 安装包中的 sadf 命令(用于查看 sar 命令的统计数据)查看,如 JSON(-j)、SVG(-g)、CSV(-d)
sar 检查系统内存统计数据 假如要查看系统上的整体的内存使用情况,可以参考命令
# sar -r ALL 1
Linux 6.8.0-1015-aws (U-3TSDMAL9IVFAQ) 	10/18/2024 	_x86_64_	(4 CPU)

02:32:53 PM kbmemfree   kbavail kbmemused  %memused kbbuffers  kbcached  kbcommit   %commit  kbactive   kbinact   kbdirty  kbanonpg    kbslab  kbkstack   kbpgtbl  kbvmused
02:32:54 PM    709824   7191784   7831332     48.38    355616   6471148  24765960     51.00   7304484   6628076       656   7136392    819348     20320     86304    244720
02:32:55 PM    709348   7191436   7831680     48.38    355616   6471276  24765960     51.00   7304876   6628076       720   7136644    819348     20348     86392    244752
02:32:56 PM    706212   7188300   7831264     48.38    355616   6471276  24765960     51.00   7304688   6628076       512   7136420    822900     20320     86304    244752
02:32:57 PM    721052   7203152   7819660     48.31    355620   6471496  24766216     51.00   7310564   6628088       536   7142084    819440     20320     86304    244752
02:32:58 PM    720324   7202444   7820452     48.31    355620   6471560  24766216     51.00   7310664   6628108       864   7142140    819312     20320     86304    244752
^C
Average:       713352   7195423   7826878     48.35    355618   6471351  24766062     51.00   7307055   6628085       658   7138736    820070     20326     86322    244746
以下命令展示系统上的 Swap 使用情况统计
# sar -S  1
Linux 6.8.0-1015-aws (U-3TSDMAL9IVFAQ) 	10/18/2024 	_x86_64_	(4 CPU)

02:33:42 PM kbswpfree kbswpused  %swpused  kbswpcad   %swpcad
02:33:43 PM  31314692   1059840      3.27      2260      0.21
02:33:44 PM  31314692   1059840      3.27      2260      0.21
02:33:45 PM  31314692   1059840      3.27      2260      0.21
sar 检查系统 Memory Paging 统计数据 sar -B 命令会展示系统上的 Paging 的统计情况
# sar -B
Linux 3.10.0-1160.119.1.el7.x86_64 (ip-172-31-36-198.ap-northeast-3.compute.internal) 	01/20/2025 	_x86_64_	(8 CPU)
05:30:01 AM  pgpgin/s pgpgout/s   fault/s  majflt/s  pgfree/s pgscank/s pgscand/s pgsteal/s    %vmeff
05:40:01 AM      0.00     14.84   4302.11      0.00   3794.73      0.00      0.00      0.00      0.00
05:50:01 AM      0.00     15.94   4232.36      0.00   3739.51      0.00      0.00      0.00      0.00
...
Average:         0.00     23.34   4513.89      0.00   4798.12      0.00      0.00      0.00      0.00
其中每列数据说明如下:
pgpgin/s - 每秒从磁盘读入的页面数(以页为单位)。 如果值较高,可能表示系统频繁从磁盘加载内存页,通常与内存不足有关。 pgpgout/s - 每秒从内存写入到磁盘的页面数(以页为单位)。 较高的值可能表示系统正在将内存页面写入交换空间(swap)或磁盘文件,可能是内存压力的表现。 fault/s - 每秒发生的页面错误(page faults)的次数,主要发生在进程所需的内容不存在于内存中,需要从存储设备加载所需内容,包括:
Minor Page Faults : 页面在内存中但没有映射到进程地址空间。典型的如 Shared LiibrafiesMajor Page Faults : 需要从磁盘加载内容(页面)。
majflt/s - 每秒发生的 Major Page Faults 的次数,如果值高,表示系统频繁需要从磁盘加载内存页,通常是内存不足或某些进程访问大量未缓存数据的表现。 pgfree/s - 每秒释放的内存页面数。系统将内存页面标记为可用(free)的频率。pgscank/s - 每秒扫描的内存页面数(以页为单位)用于回收内存。通常由内核的页回收(Linux kswapd)机制触发, 值较高可能表示内存不足或压力较大 。pgscand/s - 每秒扫描的直接回收内存页面数(以页为单位)。 如果值较高,可能是内存不足导致的直接回收操作。 pgsteal/s - 每秒从缓存或活动内存中被回收的页面数(以页为单位)。 较高的值通常表示内存压力。 %vmeff - 页回收效率( pgsteal/pgscank 的百分比)。如果接近 100%,表示内存回收机制效率较高。低值表示内存回收效果不佳,可能是内存不足或工作集过大导致。
sar 检查系统 CPU 统计数据 CPU 整体使用率情况统计 假如要查看系统上的整体的 CPU 使用情况,可以参考命令
# sar -u ALL 1
Linux 6.8.0-1015-aws (U-3TSDMAL9IVFAQ) 	10/18/2024 	_x86_64_	(4 CPU)

02:42:41 PM     CPU      %usr     %nice      %sys   %iowait    %steal      %irq     %soft    %guest    %gnice     %idle
02:42:42 PM     all     14.29      0.00      1.23      0.00      6.40      0.00      0.49      0.00      0.00     77.59
02:42:43 PM     all      9.14      0.00      2.22      0.00      4.20      0.00      0.00      0.00      0.00     84.44
02:42:44 PM     all     10.78      0.00      6.13      0.00      8.33      0.00      0.00      0.00      0.00     74.75
02:42:45 PM     all      8.60      0.00      1.72      0.00      4.42      0.00      0.00      0.00      0.00     85.26
其中每列数据说明如下:
%usr : User CPU Time, 在用户态执行进程所占的 CPU 时间百分比。%nice : Nice CPU Time, 在用户态下以改变了优先级(nice 值)的进程所占的 CPU 时间百分比。%sys : System CPU Time, 在内核态执行进程(系统调用)所占的 CPU 时间百分比。%iowait : I/O Wait, CPU 等待 I/O 完成的时间百分比。%steal : Steal Time, 虚拟化环境中,CPU 等待物理 CPU 被其他虚拟机使用的时间百分比。这个值相对较高是虚拟化环境中的常见现象。%irq : Interrupt Requests, 硬件中断处理所占的 CPU 时间百分比。%soft : Soft IRQ, 软中断处理所占的 CPU 时间百分比。%guest : Guest Time, 虚拟机内部运行进程所占的 CPU 时间百分比。系统上安装了其他虚拟机时会占用此指标。%gnice : Guest Nice Time, 在虚拟机中以改变了优先级运行的进程所占的 CPU 时间百分比。为 0 表示没有 CPU 时间被分配给虚拟机中带有改变优先级的进程。
系统负载相关统计数据 查看系统 CPU 负载情况,命令帮助参考 sar --help。-q 选项支持查看:
LOAD : Queue length and load average statistics [A_QUEUE],默认值CPU : Pressure-stall CPU statistics [A_PSI_CPU]IO : Pressure-stall I/O statistics [A_PSI_IO]MEM : Pressure-stall memory statistics [A_PSI_MEM]
# sar -q 1 5
Linux 6.8.0-1015-aws (U-3TSDMAL9IVFAQ) 	10/18/2024 	_x86_64_	(4 CPU)

02:45:55 PM   runq-sz  plist-sz   ldavg-1   ldavg-5  ldavg-15   blocked
02:45:56 PM         1      1269      0.86      1.21      1.07         0
02:45:57 PM         0      1269      0.86      1.21      1.07         0
02:45:58 PM         1      1269      0.95      1.22      1.07         0
02:45:59 PM         0      1269      0.95      1.22      1.07         0
02:46:00 PM         2      1269      0.95      1.22      1.07         0
Average:            1      1269      0.91      1.22      1.07         0
其中每列数据说明如下:
runq-sz : Run Queue Size, 表示运行队列中的进程数,即正在等待 CPU 执行的进程数量。plist-sz : Process List Size, 表示进程表中的进程总数(无论进程的状态如何)。ldavg-1 : Load Average over 1 Minuteblocked : 表示当前处于阻塞状态的进程数,通常是等待 I/O(例如等待磁盘操作完成)的进程。
CPU 使用率的统计情况
# sar -q CPU 1 3
Linux 6.8.0-1015-aws (U-3TSDMAL9IVFAQ) 	10/18/2024 	_x86_64_	(4 CPU)

03:06:56 PM  %scpu-10  %scpu-60 %scpu-300     %scpu
03:06:57 PM      2.07      1.96      3.89      2.99
03:06:58 PM      2.06      1.96      3.88      1.74
03:06:59 PM      2.06      1.96      3.88      1.94
Average:         2.06      1.96      3.88      2.22
其中每列数据说明如下:
%scpu-10 : 过去 10 秒内的 CPU 使用百分比平均值%scpu : 当前时间点的 CPU 使用率。
内存使用率的统计情况
# sar -q MEM 1 5
Linux 6.8.0-1015-aws (U-3TSDMAL9IVFAQ) 	10/18/2024 	_x86_64_	(4 CPU)

02:48:16 PM  %smem-10  %smem-60 %smem-300     %smem  %fmem-10  %fmem-60 %fmem-300     %fmem
02:48:17 PM      0.00      0.00      0.00      0.00      0.00      0.00      0.00      0.00
02:48:18 PM      0.00      0.00      0.00      0.00      0.00      0.00      0.00      0.00
02:48:19 PM      0.00      0.00      0.00      0.00      0.00      0.00      0.00      0.00
02:48:20 PM      0.00      0.00      0.00      0.00      0.00      0.00      0.00      0.00
02:48:21 PM      0.00      0.00      0.00      0.00      0.00      0.00      0.00      0.00
Average:         0.00      0.00      0.00      0.00      0.00      0.00      0.00      0.00
其中每列数据说明如下:
%smem : 当前时刻的系统内存使用百分比。%fmem : 当前时刻的文件内存使用百分比。
IO 使用率情况统计
# sar -q IO 1 3
Linux 6.8.0-1015-aws (U-3TSDMAL9IVFAQ) 	10/18/2024 	_x86_64_	(4 CPU)

03:10:54 PM   %sio-10   %sio-60  %sio-300      %sio   %fio-10   %fio-60  %fio-300      %fio
03:10:55 PM      0.00      0.00      0.00      0.04      0.00      0.00      0.00      0.04
03:10:56 PM      0.00      0.00      0.00      0.00      0.00      0.00      0.00      0.00
03:10:57 PM      0.00      0.00      0.00      0.00      0.00      0.00      0.00      0.00
Average:         0.00      0.00      0.00      0.01      0.00      0.00      0.00      0.01
sar 检查系统 IO 统计数据 sar -b 检查系统 IO 统计数据
sar -b 选项用于 统计系统级别的 I/O 速率,它主要衡量的是 块设备的 I/O 负载 ,但不是具体到单个磁盘设备,而是整个系统的 缓冲 I/O 读写情况 。VFS(Virtual File System)层的 I/O 交互情况,涉及 文件系统的读写请求 ,但不是直接的物理磁盘操作 。
# sar -b 1 5
Linux 6.8.0-1015-aws (U-3TSDMAL9IVFAQ) 	10/18/2024 	_x86_64_	(4 CPU)

02:54:25 PM       tps      rtps      wtps      dtps   bread/s   bwrtn/s   bdscd/s
02:54:26 PM      2.00      0.00      2.00      0.00      0.00    224.00      0.00
02:54:27 PM      4.00      0.00      4.00      0.00      0.00    192.00      0.00
02:54:28 PM      0.00      0.00      0.00      0.00      0.00      0.00      0.00
02:54:29 PM      1.00      0.00      1.00      0.00      0.00      8.00      0.00
02:54:30 PM      0.00      0.00      0.00      0.00      0.00      0.00      0.00
Average:         1.40      0.00      1.40      0.00      0.00     84.80      0.00
其中每列数据说明如下:
tps : Transfers per second, 每秒钟系统执行的 I/O 请求总数(读和写请求的总和)rtps : Read transfers per second, 每秒钟发起的读请求数。wtps : Write transfers per second, 每秒钟发起的写请求数。dtps : Discard transfers per second, 每秒钟的丢弃操作次数。bread/s : Blocks read per second, 每秒钟读取的块数(数据块的单位取决于系统的配置,通常为 512 字节)。bwrtn/s : Blocks written per second, 每秒钟写入的块数bdscd/s : Blocks discarded per second, 每秒钟被丢弃的块数(例如,通过 trim/discard 操作减少 SSD 的写放大)。
sar 统计磁盘读写情况 sar 命令统计磁盘读写相关数据使用选项 -d
-d 选项用于 统计磁盘设备级别的 I/O 负载,它提供 每个磁盘设备的读写 情况,包括 IOPS、数据吞吐量和平均等待时间 。它直接统计的是物理磁盘的 I/O 负载,而不是文件系统层的数据 。
# sar -d 1 3
Linux 3.10.0-1160.114.2.el7.x86_64 (zzxhy-admin) 	10/18/2024 	_x86_64_	(8 CPU)

04:17:07 PM       DEV       tps  rd_sec/s  wr_sec/s  avgrq-sz  avgqu-sz     await     svctm     %util
04:17:08 PM  dev259-0      3.00      0.00     87.00     29.00      0.00      0.67      1.00      0.30

04:17:08 PM       DEV       tps  rd_sec/s  wr_sec/s  avgrq-sz  avgqu-sz     await     svctm     %util
04:17:09 PM  dev259-0      3.00      0.00     78.00     26.00      0.00      0.33      1.00      0.30

04:17:09 PM       DEV       tps  rd_sec/s  wr_sec/s  avgrq-sz  avgqu-sz     await     svctm     %util
04:17:10 PM  dev259-0      3.00      0.00     91.00     30.33      0.00      0.33      1.00      0.30

Average:          DEV       tps  rd_sec/s  wr_sec/s  avgrq-sz  avgqu-sz     await     svctm     %util
Average:     dev259-0      3.00      0.00     85.33     28.44      0.00      0.44      1.00      0.30
其中每列数据说明如下:
DEV : 表示设备名称tps : Transactions per Second, 每秒钟执行的 I/O 操作数(包括读写请求)。rd_sec/s : Read Sectors per Second, 每秒读取的扇区数(扇区的大小通常为 512 字节)。wr_sec/s : Write Sectors per Second, 每秒写入的扇区数。avgrq-sz : Average Request Size, I/O 请求的平均大小(以扇区为单位)。例如,avgrq-sz 为 29.00,表示每个 I/O 请求平均涉及 29 个扇区。avgqu-sz : Average Queue Size, I/O 请求队列的平均长度。await : Average Wait Time, I/O 请求的平均等待时间(以毫秒为单位),包括排队和服务时间。svctm : Service Time, I/O 请求的平均服务时间(以毫秒为单位)。%util : Percentage of CPU Time Used for I/O Operations, 设备的 I/O 操作占用的时间百分比,表示设备忙碌的程度。
选项
统计范围
主要指标
适用场景
sar -b文件系统层(VFS)
TPS、块读取/写入速率
分析 应用层 的 I/O 负载,比如数据库、日志写入
sar -d物理磁盘(存储)层
IOPS、吞吐量、队列长度、利用率
分析 磁盘(存储设备) 瓶颈,判断是否需要升级存储
sar 统计文件系统分区使用情况 # sar -F 1 3 Linux 3.10.0-1160.114.2.el7.x86_64 (zzxhy-admin) 10/18/2024 _x86_64_ (8 CPU) 04:26:29 PM MBfsfree MBfsused %fsused %ufsused Ifree Iused %Iused FILESYSTEM 04:26:30 PM 534794 512747 48.95 48.95 534097719 2248329 0.42 /dev/nvme0n1p1 04:26:30 PM MBfsfree MBfsused %fsused %ufsused Ifree Iused %Iused FILESYSTEM 04:26:31 PM 534794 512747 48.95 48.95 534097719 2248329 0.42 /dev/nvme0n1p1 04:26:31 PM MBfsfree MBfsused %fsused %ufsused Ifree Iused %Iused FILESYSTEM 04:26:32 PM 534794 512747 48.95 48.95 534097719 2248329 0.42 /dev/nvme0n1p1 Summary: MBfsfree MBfsused %fsused %ufsused Ifree Iused %Iused FILESYSTEM Summary 534794 512747 48.95 48.95 534097719 2248329 0.42 /dev/nvme0n1p1
其中每列数据说明如下:
MBfsfree : Megabytes of Free Filesystem Space, 文件系统中剩余的可用空间,以 MB 为单位。MBfsused : Megabytes of Used Filesystem Space, 文件系统中已使用的空间,以 MB 为单位。%fsused : Percentage of Filesystem Used, 文件系统已使用空间的百分比。%ufsused : User Filesystem Usage Percentage, 与 %fsused 相同,表示用户文件系统已使用空间的百分比。Ifree : Inodes Free, 文件系统中剩余的可用 inode 数量。Inodes 是存储文件元数据的结构,如文件名、文件大小、文件权限等。Iused : Inodes Used, 文件系统中已使用的 inode 数量。%Iused : Percentage of Inodes Used, 文件系统已使用 inode 的百分比。FILESYSTEM : 文件系统的挂载点或设备名。例如,/dev/nvme0n1p1 是一个 NVMe 磁盘分区。
sar 统计网络数据 sar 命令统计网络相关数据使用选项 -n, 帮助信息如下:
-n { <keyword> [,...] | ALL }
	Network statistics [A_NET_...]
	Keywords are:
	DEV	Network interfaces
	EDEV	Network interfaces (errors)
	NFS	NFS client
	NFSD	NFS server
	SOCK	Sockets	(v4)
	IP	IP traffic	(v4)
	EIP	IP traffic	(v4) (errors)
	ICMP	ICMP traffic	(v4)
	EICMP	ICMP traffic	(v4) (errors)
	TCP	TCP traffic	(v4)
	ETCP	TCP traffic	(v4) (errors)
	UDP	UDP traffic	(v4)
	SOCK6	Sockets	(v6)
	IP6	IP traffic	(v6)
	EIP6	IP traffic	(v6) (errors)
	ICMP6	ICMP traffic	(v6)
	EICMP6	ICMP traffic	(v6) (errors)
	UDP6	UDP traffic	(v6)
	FC	Fibre channel HBAs
	SOFT	Software-based network processing
如下示例统计所有网卡上的网络数据
# sar -n DEV 1 2
Linux 6.8.0-1015-aws (U-3TSDMAL9IVFAQ) 	10/18/2024 	_x86_64_	(4 CPU)

03:55:13 PM     IFACE   rxpck/s   txpck/s    rxkB/s    txkB/s   rxcmp/s   txcmp/s  rxmcst/s   %ifutil
03:55:14 PM        lo      0.00      0.00      0.00      0.00      0.00      0.00      0.00      0.00
03:55:14 PM      eth0     56.00     92.00      4.32    279.30      0.00      0.00      0.00      0.00
03:55:14 PM      eth1      4.00      4.00      0.35      0.68      0.00      0.00      0.00      0.00
03:55:14 PM   docker0      0.00      0.00      0.00      0.00      0.00      0.00      0.00      0.00
03:55:14 PM vethc08e5f9      0.00      0.00      0.00      0.00      0.00      0.00      0.00      0.00

03:55:14 PM     IFACE   rxpck/s   txpck/s    rxkB/s    txkB/s   rxcmp/s   txcmp/s  rxmcst/s   %ifutil
03:55:15 PM        lo      0.00      0.00      0.00      0.00      0.00      0.00      0.00      0.00
03:55:15 PM      eth0     85.00     92.00      7.87    176.03      0.00      0.00      0.00      0.00
03:55:15 PM      eth1      4.00      4.00      0.34      0.43      0.00      0.00      0.00      0.00
03:55:15 PM   docker0      0.00      0.00      0.00      0.00      0.00      0.00      0.00      0.00
03:55:15 PM vethc08e5f9      0.00      0.00      0.00      0.00      0.00      0.00      0.00      0.00

Average:        IFACE   rxpck/s   txpck/s    rxkB/s    txkB/s   rxcmp/s   txcmp/s  rxmcst/s   %ifutil
Average:           lo      0.00      0.00      0.00      0.00      0.00      0.00      0.00      0.00
Average:         eth0     70.50     92.00      6.10    227.67      0.00      0.00      0.00      0.00
Average:         eth1      4.00      4.00      0.35      0.55      0.00      0.00      0.00      0.00
Average:      docker0      0.00      0.00      0.00      0.00      0.00      0.00      0.00      0.00
Average:    vethc08e5f9      0.00      0.00      0.00      0.00      0.00      0.00      0.00      0.00
其中每列数据说明如下:
IFACE : 网络接口名称rxpck/s : Receive Packets per Second, 每秒接收到的数据包数量。txpck/s : Transmit Packets per Second, 每秒发送的数据包数量。rxkB/s : Received Kilobytes per Second, 每秒接收到的数据量(以 KB 为单位)txkB/s : Transmitted Kilobytes per Second, 每秒发送的数据量(以 KB 为单位)rxcmp/s : Compressed Packets Received per Second, 每秒接收到的压缩数据包数量。txcmp/s : Compressed Packets Transmitted per Second, 每秒发送的压缩数据包数量。rxmcst/s : Multicast Packets Received per Second, 每秒接收到的组播数据包数量。%ifutil : Interface Utilization Percentage, 网络接口的利用率,表示该接口的总带宽使用情况。
统计 Socket 使用情况
# sar -n SOCK 1 2
Linux 6.8.0-1015-aws (U-3TSDMAL9IVFAQ) 	10/18/2024 	_x86_64_	(4 CPU)

04:05:21 PM    totsck    tcpsck    udpsck    rawsck   ip-frag    tcp-tw
04:05:22 PM      1577        36        20         0         0         3
04:05:23 PM      1577        36        20         0         0         3
Average:         1577        36        20         0         0         3
监控 IP 层的网络活动情况
# sar -n IP 1 2
Linux 6.8.0-1015-aws (U-3TSDMAL9IVFAQ) 	10/18/2024 	_x86_64_	(4 CPU)

04:06:39 PM    irec/s  fwddgm/s    idel/s     orq/s   asmrq/s   asmok/s  fragok/s fragcrt/s
04:06:40 PM     43.00      0.00     43.00     47.00      0.00      0.00      0.00      0.00
04:06:41 PM     71.00      0.00     71.00     77.00      0.00      0.00      0.00      0.00
Average:        57.00      0.00     57.00     62.00      0.00      0.00      0.00      0.00
其中每列数据说明如下:
irec/s : Incoming Packets Received per Second, 每秒接收到的 IP 数据包数量。fwddgm/s : Forwarded Datagrams per Second, 每秒被路由转发的 IP 数据包数量(如果系统配置为路由器)。idel/s : Incoming Datagrams Delivered per Second, 每秒成功交付给上层协议(如 TCP/UDP)的 IP 数据包数量。orq/s : Outgoing Request Packets per Second, 每秒发出的 IP 数据包请求数。asmrq/s : Address Mask Requests per Second, 每秒发送的地址掩码请求数据包数。asmok/s : Address Mask Replies per Second, 每秒发送的地址掩码应答数据包数。fragok/s : Fragmentation OK per Second, 每秒成功处理的 IP 数据包碎片数。fragcrt/s : Fragmentation Created per Second, 每秒创建的 IP 数据包碎片数。
监控 TCP 层的网络活动情况
# sar -n TCP 1 2
Linux 6.8.0-1015-aws (U-3TSDMAL9IVFAQ) 	10/18/2024 	_x86_64_	(4 CPU)

04:13:34 PM  active/s passive/s    iseg/s    oseg/s
04:13:35 PM      0.00      0.00     79.00    104.00
04:13:36 PM      0.00      0.00     31.00     51.00
Average:         0.00      0.00     55.00     77.50
其中每列数据说明如下:
active/s : Active Connections per Second, 每秒发起的主动连接请求数量(客户端发起的 TCP 连接,如 HTTP 请求)。passive/s : Passive Connections per Second, 每秒接受的被动连接请求数量(服务器接受的 TCP 连接,如服务端的 TCP 监听)。iseg/s : Incoming Segments per Second, 每秒接收到的 TCP 段数量oseg/s : Outgoing Segments per Second, 每秒发送的 TCP 段数量。
网络协议栈性能计数器及网卡统计数据 ethtool 工具用于查看或者修改网卡配置(network driver and hardware settings),具体使用请参考 man ethtool
ethtool eno1 查看网卡详细配置及物理状态信息
# ethtool eno1
Settings for eno1:
	Supported ports: [ TP ]
	Supported link modes:   10baseT/Half 10baseT/Full
	                        100baseT/Half 100baseT/Full
	                        1000baseT/Full
	Supported pause frame use: Symmetric
	Supports auto-negotiation: Yes
	Supported FEC modes: Not reported
	Advertised link modes:  10baseT/Half 10baseT/Full
	                        100baseT/Half 100baseT/Full
	                        1000baseT/Full
	Advertised pause frame use: Symmetric
	Advertised auto-negotiation: Yes
	Advertised FEC modes: Not reported
	Speed: 1000Mb/s
	Duplex: Full
	Auto-negotiation: on
	Port: Twisted Pair
	PHYAD: 1
	Transceiver: internal
	MDI-X: off (auto)
	Supports Wake-on: pumbg
	Wake-on: g
        Current message level: 0x00000007 (7)
                               drv probe link
	Link detected: yes
ethtool -k | --show-features | --show-offload 可以查看网卡的可调节的参数及其当前值,ethtool -K | --features | --offload 可用于调整对应值
# ethtool -k eno1
Features for eno1:
rx-checksumming: on
tx-checksumming: on
	tx-checksum-ipv4: off [fixed]
	tx-checksum-ip-generic: on
	tx-checksum-ipv6: off [fixed]
	tx-checksum-fcoe-crc: off [fixed]
	tx-checksum-sctp: on
scatter-gather: on
	tx-scatter-gather: on
	tx-scatter-gather-fraglist: off [fixed]
tcp-segmentation-offload: on
	tx-tcp-segmentation: on
	tx-tcp-ecn-segmentation: off [fixed]
	tx-tcp-mangleid-segmentation: off
	tx-tcp6-segmentation: on
generic-segmentation-offload: on
generic-receive-offload: on
large-receive-offload: off [fixed]
rx-vlan-offload: on
tx-vlan-offload: on
ntuple-filters: off
receive-hashing: on
highdma: on [fixed]
rx-vlan-filter: on [fixed]
vlan-challenged: off [fixed]
tx-lockless: off [fixed]
netns-local: off [fixed]
tx-gso-robust: off [fixed]
tx-fcoe-segmentation: off [fixed]
tx-gre-segmentation: on
tx-gre-csum-segmentation: on
tx-ipxip4-segmentation: on
tx-ipxip6-segmentation: on
tx-udp_tnl-segmentation: on
tx-udp_tnl-csum-segmentation: on
tx-gso-partial: on
tx-tunnel-remcsum-segmentation: off [fixed]
tx-sctp-segmentation: off [fixed]
tx-esp-segmentation: off [fixed]
tx-udp-segmentation: on
tx-gso-list: off [fixed]
fcoe-mtu: off [fixed]
tx-nocache-copy: off
loopback: off [fixed]
rx-fcs: off [fixed]
rx-all: off
tx-vlan-stag-hw-insert: off [fixed]
rx-vlan-stag-hw-parse: off [fixed]
rx-vlan-stag-filter: off [fixed]
l2-fwd-offload: off [fixed]
hw-tc-offload: on
esp-hw-offload: off [fixed]
esp-tx-csum-hw-offload: off [fixed]
rx-udp_tunnel-port-offload: off [fixed]
tls-hw-tx-offload: off [fixed]
tls-hw-rx-offload: off [fixed]
rx-gro-hw: off [fixed]
tls-hw-record: off [fixed]
rx-gro-list: off
macsec-hw-offload: off [fixed]
rx-udp-gro-forwarding: off
hsr-tag-ins-offload: off [fixed]
hsr-tag-rm-offload: off [fixed]
hsr-fwd-offload: off [fixed]
hsr-dup-offload: off [fixed]
ethtool -S 或者 ethtool --statistics 查看网卡的状态统计数据
# ethtool -S eno1
NIC statistics:
     rx_packets: 87025592139
     tx_packets: 26590780377
     rx_bytes: 119151794749314
     tx_bytes: 3283131295037
     rx_broadcast: 189267
     tx_broadcast: 0
     rx_multicast: 1
     tx_multicast: 10791
     multicast: 1
     collisions: 0
     rx_crc_errors: 0
     rx_no_buffer_count: 1021
     rx_missed_errors: 0
     tx_aborted_errors: 0
     tx_carrier_errors: 0
     tx_window_errors: 0
     tx_abort_late_coll: 0
     tx_deferred_ok: 0
     tx_single_coll_ok: 0
     tx_multi_coll_ok: 0
     tx_timeout_count: 0
     rx_long_length_errors: 0
     rx_short_length_errors: 0
     rx_align_errors: 0
     tx_tcp_seg_good: 100662468
     tx_tcp_seg_failed: 0
     rx_flow_control_xon: 0
     rx_flow_control_xoff: 0
     tx_flow_control_xon: 901
     tx_flow_control_xoff: 900
     rx_long_byte_count: 119151794749314
     tx_dma_out_of_sync: 0
     tx_smbus: 0
     rx_smbus: 0
     dropped_smbus: 0
     os2bmc_rx_by_bmc: 0
     os2bmc_tx_by_bmc: 0
     os2bmc_tx_by_host: 0
     os2bmc_rx_by_host: 0
     tx_hwtstamp_timeouts: 0
     tx_hwtstamp_skipped: 0
     rx_hwtstamp_cleared: 0
     rx_errors: 0
     tx_errors: 0
     tx_dropped: 0
     rx_length_errors: 0
     rx_over_errors: 0
     rx_frame_errors: 0
     rx_fifo_errors: 0
     tx_fifo_errors: 0
     tx_heartbeat_errors: 0
     tx_queue_0_packets: 6635822565
     tx_queue_0_bytes: 791330905648
     tx_queue_0_restart: 16
     tx_queue_1_packets: 6661270446
     tx_queue_1_bytes: 795656191826
     tx_queue_1_restart: 20
     tx_queue_2_packets: 6646380698
     tx_queue_2_bytes: 791641135622
     tx_queue_2_restart: 12
     tx_queue_3_packets: 6647306668
     tx_queue_3_bytes: 794205682337
     tx_queue_3_restart: 7
     rx_queue_0_packets: 21619752678
     rx_queue_0_bytes: 29679206059995
     rx_queue_0_drops: 0
     rx_queue_0_csum_err: 3535
     rx_queue_0_alloc_failed: 0
     rx_queue_1_packets: 22178720293
     rx_queue_1_bytes: 29791943838906
     rx_queue_1_drops: 0
     rx_queue_1_csum_err: 3676
     rx_queue_1_alloc_failed: 0
     rx_queue_2_packets: 21622389349
     rx_queue_2_bytes: 29676136085303
     rx_queue_2_drops: 0
     rx_queue_2_csum_err: 3714
     rx_queue_2_alloc_failed: 0
     rx_queue_3_packets: 21604729819
     rx_queue_3_bytes: 29656406396554
     rx_queue_3_drops: 0
     rx_queue_3_csum_err: 3712
     rx_queue_3_alloc_failed: 0
ethtool -i 或者 ethtool --driver 查看网卡驱动程序的信息
# ethtool -i eno1
driver: igb
version: 5.15.0-83-generic
firmware-version: 3.25, 0x800005cc
expansion-rom-version:
bus-info: 0000:01:00.0
supports-statistics: yes
supports-test: yes
supports-eeprom-access: yes
supports-register-dump: yes
supports-priv-flags: yes
sar sar 检查网络协议相关统计数据
netstat 查看内核中的 TCPIP 协议栈性能统计计数器 。使用 netstat -s 可以查看内核 TCPIP 协议栈的详细统计数据,并可以根据其判断系统网络方面的性能。
# netstat -s
Ip:
    Forwarding: 1
    384590438059 total packets received
    3 with invalid headers
    43474449709 forwarded
    2167 with unknown protocol
    0 incoming packets discarded
    341069794235 incoming packets delivered
    384566797199 requests sent out
    103 outgoing packets dropped
    1 fragments dropped after timeout
    28 reassemblies required
    13 packets reassembled ok
    1 packet reassemblies failed
Icmp:
    32330897 ICMP messages received
    14098 input ICMP message failed
    InCsumErrors: 51
    ICMP input histogram:
        destination unreachable: 1796792
        timeout in transit: 6331
        echo requests: 30526292
        echo replies: 1178
        timestamp request: 232
        timestamp reply: 11
    62805469 ICMP messages sent
    0 ICMP messages failed
    ICMP output histogram:
        destination unreachable: 32278700
        time exceeded: 4
        redirect: 3
        echo requests: 238
        echo replies: 30526524
IcmpMsg:
        InType0: 1178
        InType3: 1796792
        InType8: 30526292
        InType11: 6331
        InType13: 232
        InType14: 11
        InType69: 10
        OutType0: 30526524
        OutType3: 32278700
        OutType5: 3
        OutType8: 238
        OutType11: 4
Tcp:
    21686491 active connection openings
    65527122 passive connection openings
    1928790 failed connection attempts
    3612983 connection resets received
    9 connections established
    339032417473 segments received
    339142282955 segments sent out
    32037581 segments retransmitted
    7245 bad segments received
    3192175 resets sent
    InCsumErrors: 6679
Udp:
    2003641625 packets received
    1392413 packets to unknown port received
    83 packet receive errors
    2006461101 packets sent
    0 receive buffer errors
    0 send buffer errors
    InCsumErrors: 83
UdpLite:
TcpExt:
    767072 resets received for embryonic SYN_RECV sockets
    1131 ICMP packets dropped because they were out-of-window
    67776454 TCP sockets finished time wait in fast timer
    13268 time wait sockets recycled by time stamp
    2641 packetes rejected in established connections because of timestamp
    49088454 delayed acks sent
    10849 delayed acks further delayed because of locked socket
    Quick ack mode was activated 147021 times
    1128470 times the listen queue of a socket overflowed
    1132180 SYNs to LISTEN sockets dropped
    338206155247 packet headers predicted
    216616465 acknowledgments not containing data payload received
    338112668573 predicted acknowledgments
    8248 times recovered from packet loss due to fast retransmit
    TCPSackRecovery: 32632
    TCPSACKReneging: 142
    Detected reordering 30116 times using SACK
    Detected reordering 47543 times using reno fast retransmit
    Detected reordering 148 times using time stamp
    71 congestion windows fully recovered without slow start
    106 congestion windows partially recovered using Hoe heuristic
    TCPDSACKUndo: 4370
    2568 congestion windows recovered without slow start after partial ack
    TCPLostRetransmit: 204701
    2556 timeouts after reno fast retransmit
    TCPSackFailures: 7494
    10675 timeouts in loss state
    864122 fast retransmits
    29266 retransmits in slow start
    TCPTimeouts: 36186496
    TCPLossProbes: 116389
    TCPLossProbeRecovery: 7354
    TCPRenoRecoveryFail: 1539
    TCPSackRecoveryFail: 3888
    TCPBacklogCoalesce: 37778
    TCPDSACKOldSent: 142693
    TCPDSACKOfoSent: 248
    TCPDSACKRecv: 38264
    TCPDSACKOfoRecv: 266
    8864 connections reset due to unexpected data
    28421 connections reset due to early user close
    606030 connections aborted due to timeout
    TCPSACKDiscard: 43
    TCPDSACKIgnoredOld: 19
    TCPDSACKIgnoredNoUndo: 32190
    TCPSpuriousRTOs: 85
    TCPSackShifted: 1622734
    TCPSackMerged: 915004
    TCPSackShiftFallback: 369388
    TCPRcvCoalesce: 11330422
    TCPOFOQueue: 112090
    TCPOFOMerge: 230
    TCPChallengeACK: 6858
    TCPSYNChallenge: 3674
    TCPFastOpenCookieReqd: 214
    TCPAutoCorking: 334626
    TCPFromZeroWindowAdv: 62
    TCPToZeroWindowAdv: 62
    TCPWantZeroWindowAdv: 2239
    TCPSynRetrans: 30942068
    TCPOrigDataSent: 338573719650
    TCPACKSkippedSynRecv: 168417
    TCPACKSkippedPAWS: 44
    TCPACKSkippedSeq: 219
    TCPACKSkippedTimeWait: 190
    TCPACKSkippedChallenge: 321
    TCPWinProbe: 28
    TCPKeepAlive: 4616779
    TCPDelivered: 338593720604
    TCPAckCompressed: 41721
    TcpTimeoutRehash: 730537
    TcpDuplicateDataRehash: 3146
    TCPDSACKRecvSegs: 38486
    TCPDSACKIgnoredDubious: 46
IpExt:
    OutMcastPkts: 56
    InOctets: 196303595753835
    OutOctets: 312863302039368
    OutMcastOctets: 2240
    InNoECTPkts: 452519828597
    InECT1Pkts: 3421
    InECT0Pkts: 9889702
    InCEPkts: 4987
MPTcpExt:
nstat nstat 工具输出内核 TCPIP 协议栈统计计数器和网卡统计数据(kernel snmp counters and network interface statistics)
# nstat # kernel IpInReceives 384590811288 0.0 IpInHdrErrors 3 0.0 IpForwDatagrams 43474616719 0.0 IpInUnknownProtos 2167 0.0 IpInDelivers 341070000295 0.0 IpOutRequests 384567170418 0.0 IpOutDiscards 103 0.0 IpReasmTimeout 1 0.0 IpReasmReqds 28 0.0 IpReasmOKs 13 0.0 IpReasmFails 1 0.0 IcmpInMsgs 32330925 0.0 IcmpInErrors 14098 0.0 IcmpInCsumErrors 51 0.0 IcmpInDestUnreachs 1796796 0.0 IcmpInTimeExcds 6331 0.0 IcmpInEchos 30526316 0.0 IcmpInEchoReps 1178 0.0 IcmpInTimestamps 232 0.0 IcmpInTimestampReps 11 0.0 IcmpOutMsgs 62805652 0.0 IcmpOutDestUnreachs 32278859 0.0 IcmpOutTimeExcds 4 0.0 IcmpOutRedirects 3 0.0 IcmpOutEchos 238 0.0 IcmpOutEchoReps 30526548 0.0 IcmpMsgInType0 1178 0.0 IcmpMsgInType3 1796796 0.0 IcmpMsgInType8 30526316 0.0 IcmpMsgInType11 6331 0.0 IcmpMsgInType13 232 0.0 IcmpMsgInType14 11 0.0 IcmpMsgInType69 10 0.0 IcmpMsgOutType0 30526548 0.0 IcmpMsgOutType3 32278859 0.0 IcmpMsgOutType5 3 0.0 IcmpMsgOutType8 238 0.0 IcmpMsgOutType11 4 0.0 TcpActiveOpens 21686501 0.0 TcpPassiveOpens 65527253 0.0 TcpAttemptFails 1928798 0.0 TcpEstabResets 3612983 0.0 TcpInSegs 339032607168 0.0 TcpOutSegs 339142472728 0.0 TcpRetransSegs 32037585 0.0 TcpInErrs 7245 0.0 TcpOutRsts 3192176 0.0 TcpInCsumErrors 6679 0.0 UdpInDatagrams 2003657962 0.0 UdpNoPorts 1392413 0.0 UdpInErrors 83 0.0 UdpOutDatagrams 2006477437 0.0 UdpInCsumErrors 83 0.0 Ip6InReceives 62868 0.0 Ip6InDiscards 3 0.0 Ip6InDelivers 62865 0.0 Ip6OutRequests 84456 0.0 Ip6OutNoRoutes 3015007 0.0 Ip6InMcastPkts 1 0.0 Ip6OutMcastPkts 21592 0.0 Ip6InOctets 4275040 0.0 Ip6OutOctets 5484568 0.0 Ip6InMcastOctets 72 0.0 Ip6OutMcastOctets 1209816 0.0 Ip6InNoECTPkts 62865 0.0 Icmp6InMsgs 62865 0.0 Icmp6OutMsgs 84456 0.0 Icmp6InNeighborSolicits 31432 0.0 Icmp6InNeighborAdvertisements 31433 0.0 Icmp6OutRouterSolicits 21558 0.0 Icmp6OutNeighborSolicits 31436 0.0 Icmp6OutNeighborAdvertisements 31432 0.0 Icmp6OutMLDv2Reports 30 0.0 Icmp6InType135 31432 0.0 Icmp6InType136 31433 0.0 Icmp6OutType133 21558 0.0 Icmp6OutType135 31436 0.0 Icmp6OutType136 31432 0.0 Icmp6OutType143 30 0.0 TcpExtEmbryonicRsts 767072 0.0 TcpExtOutOfWindowIcmps 1131 0.0 TcpExtTW 67776576 0.0 TcpExtTWRecycled 13268 0.0 TcpExtPAWSEstab 2641 0.0 TcpExtDelayedACKs 49088568 0.0 TcpExtDelayedACKLocked 10849 0.0 TcpExtDelayedACKLost 147021 0.0 TcpExtListenOverflows 1128474 0.0 TcpExtListenDrops 1132184 0.0 TcpExtTCPHPHits 338206343925 0.0 TcpExtTCPPureAcks 216616757 0.0 TcpExtTCPHPAcks 338112857103 0.0 TcpExtTCPRenoRecovery 8248 0.0 TcpExtTCPSackRecovery 32632 0.0 TcpExtTCPSACKReneging 142 0.0 TcpExtTCPSACKReorder 30117 0.0 TcpExtTCPRenoReorder 47543 0.0 TcpExtTCPTSReorder 148 0.0 TcpExtTCPFullUndo 71 0.0 TcpExtTCPPartialUndo 106 0.0 TcpExtTCPDSACKUndo 4370 0.0 TcpExtTCPLossUndo 2568 0.0 TcpExtTCPLostRetransmit 204701 0.0 TcpExtTCPRenoFailures 2556 0.0 TcpExtTCPSackFailures 7494 0.0 TcpExtTCPLossFailures 10675 0.0 TcpExtTCPFastRetrans 864122 0.0 TcpExtTCPSlowStartRetrans 29266 0.0 TcpExtTCPTimeouts 36186504 0.0 TcpExtTCPLossProbes 116389 0.0 TcpExtTCPLossProbeRecovery 7354 0.0 TcpExtTCPRenoRecoveryFail 1539 0.0 TcpExtTCPSackRecoveryFail 3888 0.0 TcpExtTCPBacklogCoalesce 37778 0.0 TcpExtTCPDSACKOldSent 142693 0.0 TcpExtTCPDSACKOfoSent 248 0.0 TcpExtTCPDSACKRecv 38264 0.0 TcpExtTCPDSACKOfoRecv 266 0.0 TcpExtTCPAbortOnData 8864 0.0 TcpExtTCPAbortOnClose 28421 0.0 TcpExtTCPAbortOnTimeout 606034 0.0 TcpExtTCPSACKDiscard 43 0.0 TcpExtTCPDSACKIgnoredOld 19 0.0 TcpExtTCPDSACKIgnoredNoUndo 32190 0.0 TcpExtTCPSpuriousRTOs 85 0.0 TcpExtTCPSackShifted 1622734 0.0 TcpExtTCPSackMerged 915004 0.0 TcpExtTCPSackShiftFallback 369390 0.0 TcpExtTCPRcvCoalesce 11330454 0.0 TcpExtTCPOFOQueue 112090 0.0 TcpExtTCPOFOMerge 230 0.0 TcpExtTCPChallengeACK 6858 0.0 TcpExtTCPSYNChallenge 3674 0.0 TcpExtTCPFastOpenCookieReqd 214 0.0 TcpExtTCPAutoCorking 334627 0.0 TcpExtTCPFromZeroWindowAdv 62 0.0 TcpExtTCPToZeroWindowAdv 62 0.0 TcpExtTCPWantZeroWindowAdv 2239 0.0 TcpExtTCPSynRetrans 30942072 0.0 TcpExtTCPOrigDataSent 338573908729 0.0 TcpExtTCPACKSkippedSynRecv 168417 0.0 TcpExtTCPACKSkippedPAWS 44 0.0 TcpExtTCPACKSkippedSeq 219 0.0 TcpExtTCPACKSkippedTimeWait 190 0.0 TcpExtTCPACKSkippedChallenge 321 0.0 TcpExtTCPWinProbe 28 0.0 TcpExtTCPKeepAlive 4616805 0.0 TcpExtTCPDelivered 338593909685 0.0 TcpExtTCPAckCompressed 41721 0.0 TcpExtTcpTimeoutRehash 730541 0.0 TcpExtTcpDuplicateDataRehash 3146 0.0 TcpExtTCPDSACKRecvSegs 38486 0.0 TcpExtTCPDSACKIgnoredDubious 46 0.0 IpExtOutMcastPkts 56 0.0 IpExtInOctets 196303854155045 0.0 IpExtOutOctets 312863774259035 0.0 IpExtOutMcastOctets 2240 0.0 IpExtInNoECTPkts 452520298165 0.0 IpExtInECT1Pkts 3421 0.0 IpExtInECT0Pkts 9889767 0.0 IpExtInCEPkts 4987 0.0
ss ss (socket statistics) 工具可以查看系统上 Sockets 的详细信息,类似于 netstat 但提供了更多的状态统计信息,特别是 TCP 状态(如 rto 、 rtt 、 mss 、 cwnd 等数据)
ip ip 是现代操作系统用于管理 IP 地址、路由、网络设备、网络接口和 Tunnels 的主要工具,它也提供了相关组建的统计信息。如 ip -s link 可以查看网络接口相关的统计数据,ip -s -s link 可以提供更详细的统计数据
# ip -s link
1: lo: <LOOPBACK,UP,LOWER_UP> mtu 65536 qdisc noqueue state UNKNOWN mode DEFAULT group default qlen 1000
    link/loopback 00:00:00:00:00:00 brd 00:00:00:00:00:00
    RX:      bytes      packets errors dropped  missed   mcast
    79721904358202 340052829566      0       0       0       0
    TX:      bytes      packets errors dropped carrier collsns
    79721904358202 340052829566      0       0       0       0
2: eno1: <BROADCAST,MULTICAST,UP,LOWER_UP> mtu 1500 qdisc mq state UP mode DEFAULT group default qlen 1000
    link/ether ac:1f:6b:95:cc:a4 brd ff:ff:ff:ff:ff:ff
    RX:       bytes     packets errors dropped  missed   mcast
    118801074279471 87023298667      0       0       0       1
    TX:       bytes     packets errors dropped carrier collsns
      3172610650081 26589550359      0       0       0       0
    altname enp1s0

# ip -s -s link
1: lo: <LOOPBACK,UP,LOWER_UP> mtu 65536 qdisc noqueue state UNKNOWN mode DEFAULT group default qlen 1000
    link/loopback 00:00:00:00:00:00 brd 00:00:00:00:00:00
    RX:      bytes      packets errors dropped  missed   mcast
    79722044960145 340053483569      0       0       0       0
    RX errors:           length    crc   frame    fifo overrun
                              0      0       0       0       0
    TX:      bytes      packets errors dropped carrier collsns
    79722044960145 340053483569      0       0       0       0
    TX errors:          aborted   fifo  window heartbt transns
                              0      0       0       0       0
2: eno1: <BROADCAST,MULTICAST,UP,LOWER_UP> mtu 1500 qdisc mq state UP mode DEFAULT group default qlen 1000
    link/ether ac:1f:6b:95:cc:a4 brd ff:ff:ff:ff:ff:ff
    RX:       bytes     packets errors dropped  missed   mcast
    118801798871868 87023914114      0       0       0       1
    RX errors:           length    crc   frame    fifo overrun
                              0      0       0       0       0
    TX:       bytes     packets errors dropped carrier collsns
      3172671301132 26589858321      0       0       0       0
    TX errors:          aborted   fifo  window heartbt transns
                              0      0       0       0       2
    altname enp1s0
传统的 ifconfig 命令也会列出网络接口相关的统计数据
# ifconfig
br-62419161006c: flags=4163<UP,BROADCAST,RUNNING,MULTICAST>  mtu 1500
        inet 172.18.0.1  netmask 255.255.0.0  broadcast 172.18.255.255
        ether 02:42:49:b7:f0:ad  txqueuelen 0  (Ethernet)
        RX packets 3679455353  bytes 389793524839 (389.7 GB)
        RX errors 0  dropped 0  overruns 0  frame 0
        TX packets 3061575912  bytes 12921429709914 (12.9 TB)
        TX errors 0  dropped 0 overruns 0  carrier 0  collisions 0
SysRq 在某些情况,如系统内存耗尽,会导致系统(Shell,GUI)无响应,在这种场景下,可以使用 Alt+SysRq 组合键,它的全称是 System Request,内核对 Alt+SysRq 组合键有高响应优先级,通过此组合键可以完成以下内容:
Alt + SysRq + S : 同步所有挂载的文件系统。Alt + SysRq + U : 卸载所有文件系统(只读模式)。Alt + SysRq + B : 强制重启系统。Alt + SysRq + K : 杀死所有用户进程。
要启用 SysRq 功能,系统必须配置了 /proc/sys/kernel/sysrq 的值为 1,或者配置 kernel.sysrq = 1 到 /etc/sysctl.conf 中,并且只有在系统的终端中才支持这些快捷键组合,远程终端不支持
vmstat vmstat (virtual Memory Statistics) 工具可以提供系统 Memory, Paging, Block IO, Traps, Disks 和 CPU 活动的统计数据
帮助文档可以查看 man vmstat 。
查看整体内存统计数据 # vmstat 1 2 procs -----------memory---------- ---swap-- -----io---- -system-- ------cpu----- r b swpd free buff cache si so bi bo in cs us sy id wa st 3 0 0 441040 0 4655976 0 0 12 7 1 1 13 13 74 0 0 4 0 0 491416 0 4625592 0 0 0 464 43139 63211 19 14 67 0 0
输出字段说明 ,更多字段说明可参考 man vmstat
r : 处于 可运行状态(正在运行中或者正在运行队列中等待) 的进程的数量b : 处于 等待 IO 完成而被阻塞的进程数量 si : 从 磁盘 Swap In 的内存(Pagine/s)so : Swap out 到磁盘 的内存(Pagine/s)bi : 从磁盘(Block Device)读取的 Block/sbo : 写入磁盘(Block Device)的 Block/sin : The number of interrupts per second, including the clock.cs : The number of context switches per second.
默认的存储大小单位为 kilobytes ,要指定存储单位可以使用 -S, --unit [k(1000)|K(1024)|m(1000000)|M(1048576)] ,不影响Swap 和 Block 单位
# vmstat -SM 1 2
procs -----------memory---------- ---swap-- -----io---- -system-- ------cpu-----
 r  b   swpd   free   buff  cache   si   so    bi    bo   in   cs us sy id wa st
 3  0      0    652      0   4647    0    0    12     7    1    1 13 13 74  0  0
 2  0      0    651      0   4647    0    0     0     0 39654 62977 11 13 76  0  0
查看整体磁盘和分区统计数据 查看磁盘设备的数据读写统计情况
# vmstat -d 1 3
disk-   ------------reads------------     ------------writes-----------            -----IO------
        total   merged sectors    ms      total    merged sectors      ms          cur    sec
nvme0n1 9929630 142223 1634357346 7816627 37637115 4582452 994114637 32007565      0  24069
nvme0n1 9929630 142223 1634357346 7816627 37637116 4582452 994114645 32007565      0  24069
nvme0n1 9929631 142223 1634357810 7816628 37637116 4582452 994114645 32007565      0  24069
输出字段说明 ,更多字段说明可参考 man vmstat
total : Total reads completed successfullymerged : grouped reads/writes (resulting in one I/O)sectors : Sectors read successfullyms : milliseconds spent readingcur : I/O in progresssec : seconds spent for I/O
查看指定分区的数据读写统计情况
# vmstat -p /dev/nvme0n1p1 1 3
nvme0n1p1    reads   read sectors  writes    requested writes
             9929942 1634410988    37638676  994149731
             9929943 1634411020    37638677  994149739
             9929943 1634411020    37638677  994149739
输出字段说明 ,更多字段说明可参考 man vmstat
reads : Total number of reads issued to this partitionread sectors : Total read sectors for partitionwrites : Total number of writes issued to this partitionrequested writes : Total number of write requests made for partition