Systems Performance Enterprise and the Cloud v2
性能分析相关的术语
以下为性能分析中常用到的专业术语或指标 [2]
IOPS
Input/Output Operations Per Second. 用于衡量数据传输操作(Rate of Data transfer operations)的频率。对于硬盘 I/O (Disk I/O)来说,指 每秒发生的读写请求 。Throughput
吞吐量 。在网络通信中,主要指 数据传输速率(Data Rate, bytes/bits per second) 。在其他上下文(Contexts,如 Databases),Throughput 通常指 Operation Rate(Operations Per Second or Transactions Per Second)Response Time
响应时间 。一个操作执行到结束的时间。这通常包括 请求等待时间(Waiting Time) 、 被服务时间(Serviced Time) 、 传输时间(Transfer Time)Latency
延迟 。可以指某个操作(Operation)消耗在 等待被处理/服务(Time Waiting to be Serviced/Processed)的时间 。在某些上下文中,等同于 Response Time 。Utilization
使用率 。衡量资源的忙的程度。Saturation
衡量一个资源(如 CPU)的待处理队列中未处理的任务数量。Bottleneck
Workload
一般是客户端请求Cache
SUT
System Under Test 。性能测试目标Off-CPU
Off-CPU 指的是当前不在 CPU 上运行的程序的一种状态。比如在性能分析过程中,需要分析当前不在 CPU 上运行的 Process/Threads 所处的状态,通常包括导致 Task 被 Block 的原因:Disk I/O、Network I/O、Lock Contention、Explicit Sleeps、Scheduler Preemption等
Thread State Analysis
在进行性能分析的过程中,特别是 Application Performance Analysis,首先要清楚 Process/Thread/Task 所处的当前状态,至少可以将其划分为 2 个状态: [8]
- On-CPU
- Off-CPU
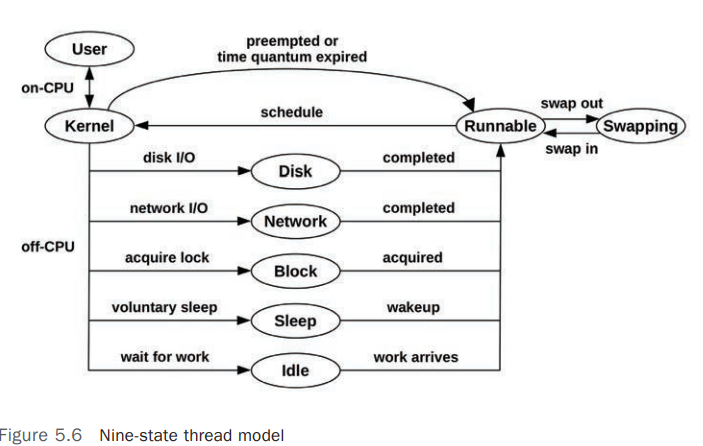
更详细的状态划分可以参考以下状态:
User: On-CPU ,用户模式(User Mode)Kernel: On-CPU,Kernel 模式Runnable: Off-CPU,正在等待调度到 CPU(等待变为 On-CPU)Swapping: Runnable,但是被Page-In阻塞(Blocked)Disk I/O: 等待 Block Device I/ONetwork I/O: 等待网络 I/O,如 Sockets 读/写Sleeping: 自愿睡眠状态(Voluntary Sleep)Lock: 等待获取锁Idle: 等待工作(Waiting for work)
Observability Tools
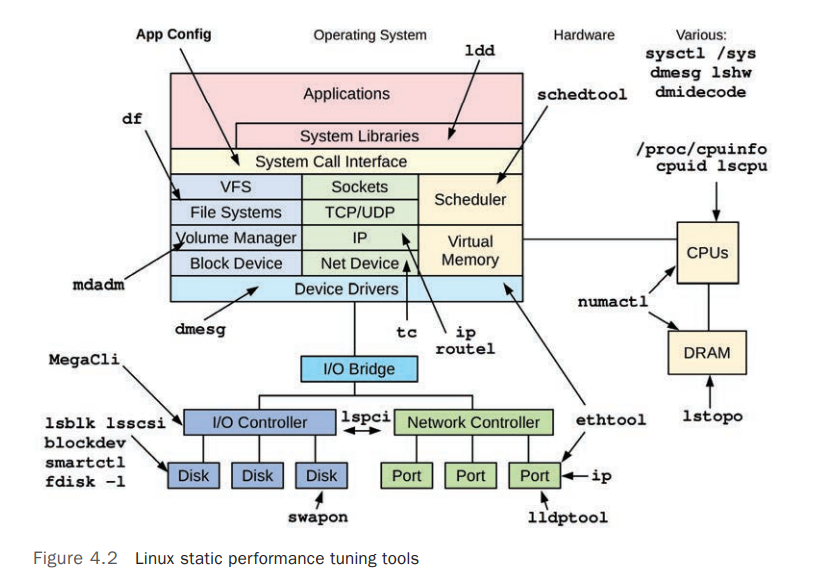
Linux 系统各个部分相关的监控工具如下图: [3]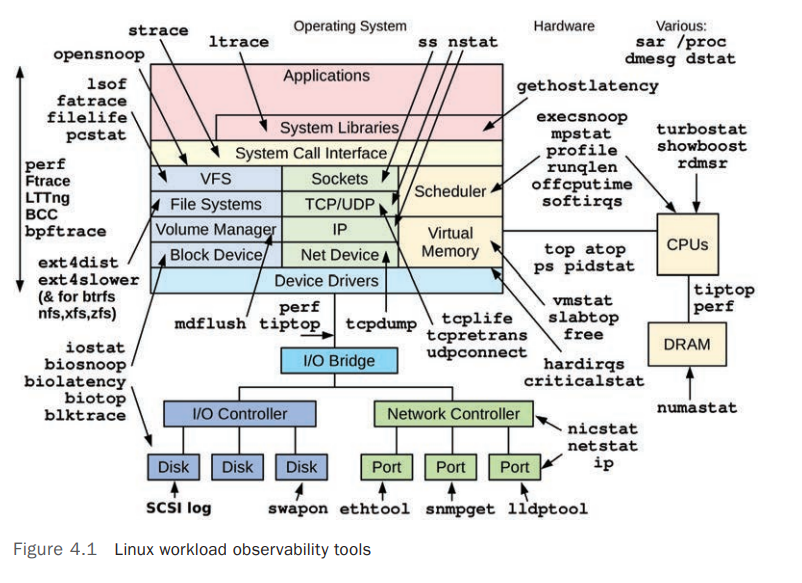
Linux Static Performance Tuning Tools: