英语单词
English Word !
English Word !
Filebeat 启动之后,会根据配置文件中配置的数据收集路径启动 1 个或者多个 inputs。针对匹配到的每个文件,Filebeat 都会启动一个对应的 harvester,每个 harvester 读取一个单独的文件内容,并将其中的新内容发送到 libbeat,libbeat 会整合数据并将其发送到配置的 output [1]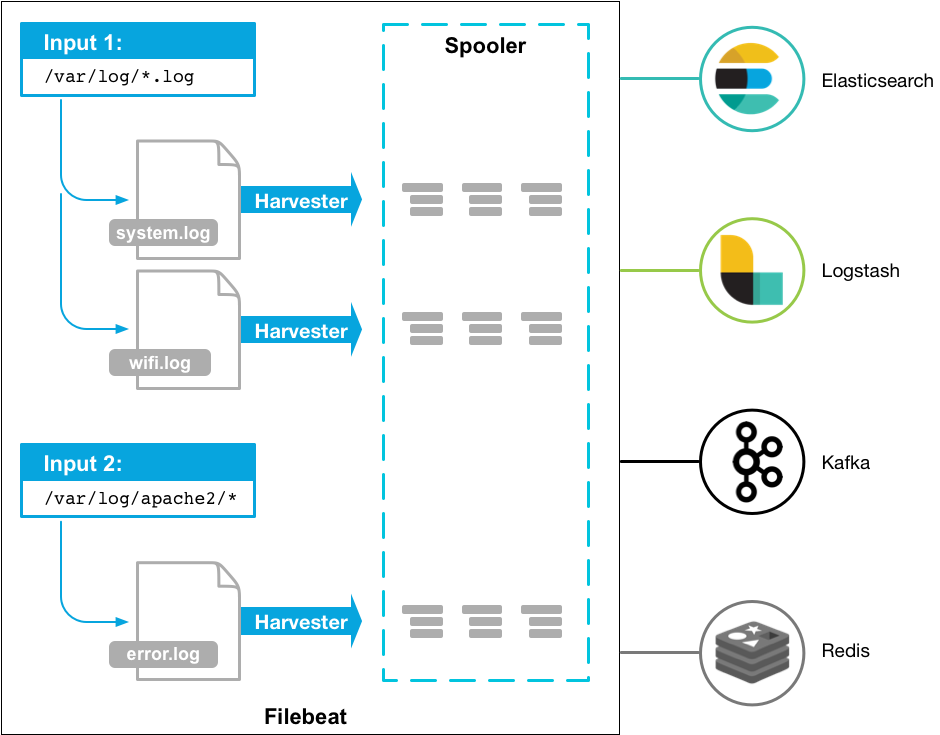
如果 input 类型为 log,input 会负责找到配置中匹配到的文件,并为每个文件启动一个 harvester。每个 input 都运行在自己独立的 Go routine (例程) 中。 [4]
Filebeat 会将收割(harvest) 的每个文件的状态存储到 registry。因此如果要让 Filebeat 从头开始收集数据,只需要删除 registry 文件即可。可以使用命令 filebeat export config 找到 data 目录,registry 位于其中。
curl -L -O https://artifacts.elastic.co/downloads/beats/filebeat/filebeat-8.8.2-x86_64.rpm |
filebeat 命令常用功能 [3]
| 子命令 | 说明 | 示例 |
|---|---|---|
help |
查看命令帮助信息filebeat help COMMAND_NAME [FLAGS] |
|
export |
导出 配置 等信息 | export 使用 |
modules |
模块管理命令。用来 enable 或者 disable 位于 modules.d 中的 模块 filebeat modules disable MODULEfilebeat modules enable MODULEfilebeat modules list |
Data collection modules |
run |
启动 filebeat | |
test |
测试配置文件 或者到 output 的连接filebeat test configfilebeat test output |
|
version |
显示当前版本信息 |
按照矿产分类,主要分为籽料与山料两种。
山料,是籽料的前身。
和田玉山料 产自昆仑山脉之中,属于原生矿,被称为 璞玉
从质地上说,有的山料的结构较为粗糙,颗粒比较明显或带石性,不带皮色,油性差,有的山料靠近外部有红糖的颜色。也有结构细密,油润度极好的优质山料。
山料因为没有受到河流的冲刷,自始至终都深藏在岩体中,缺乏外力的打磨,看起来比较干涩,所以外形大多平淡无奇,有棱有角,表面也比较干涩,绺裂现象明显。
和田玉籽料 是采自河床或者河床泥土中,经过几十万年的侵蚀打磨而得到的玉石。有时又被称为 水籽
籽料是由山料在地质活动时冲刷或滚落到河里,由河水冲刷(还有风化、风干等物理反应一起作用)形成的。籽料产自 河流中下游,是次生矿。产自河流上游的被称为 山流水料。籽料因为长久受到河流的冲刷,一般为卵石形状,表面很光滑圆润,带皮色。

和山料的存在环境不同,导致籽料有了以下特性:
籽料开采出来,外观上看就与鹅卵石一般无二,各个颜色都有,只不过他是和田玉再形成的鹅卵石。仔细观察籽料表面会发现上面密密麻麻都是一些小孔,因为这些小孔跟我们皮肤上的毛孔相似被称之为毛孔或者皮孔。和田玉籽料一般有皮色和皮孔,就算没有皮色,籽料上还是能够找到均匀的毛细孔,这是籽料独有的标志。而山料则没有皮色皮孔。
一般情况下,籽料都会拥有或深或浅的皮色,表面还会有明显的小凹坑(也就是俗称的皮孔),这是玉石长时间在水中冲刷、浸泡和磕碰造成的。而山料由于生长环境固定,不存在皮色和皮孔。
同时,由于籽料长年累月泡在水中,水里的微生物和微量元素会渗入到玉石中,所以会造成局部呈现或黄或红或黑的颜色,也就是 沁色。而这一点在山料身上,就非常不明显。
籽料的水润度是明显高于山料的,如果比较籽料和山料制作的成品,会很容易发现籽料表面质地非常润泽、光滑、细腻。而山料作品,即使经过抛光处理,表面仍会干涩,缺乏光滑的油润感,这一点用手触摸时尤为明显。
由于 和田玉籽料的密度比山料大,所以同等体积的情况下,籽料相对山料比较重
山料也有很多可以跟顶级籽料相媲美的。比如 1995 年于田县开采的 8 吨和田玉山料,白度细度等各个方面都是顶级。因品质极佳,入市后引起了轰动,后被称之位“95于田料”。时至今日,“95于田料” 在业内也是传说中的料子,被很多业内人士公认为 羊脂级。著名的和氏璧就是一块山料。
和田玉器的市场价格中羊脂玉最高、籽料高、山流水次之、山料更次之。
和田玉籽料内部结构致密,用肉眼几乎看不到内部结构;而再好的山料,还是能看到其松软质地的结构。
籽料由于有外力的挤压、打磨,所以密度要明显高过山料。籽料的话,无论是青籽还是白籽,内部结构都是致密的,用肉眼几乎看不到内部结构。而山料,无论结构多致密,在强光手电筒下,总是能看到松软的质地结构。
今天的籽料已不是传统意义上的和田籽料了。在广义和田玉的范围内,籽料也有了更多种类。
新疆除了有和田玉籽料,还出产一种颜色或绿或黑绿色等,里面也有黑点存在的岫玉。岫玉中品质好的,外观与和田玉籽料很相似,并且在市场上的和田籽料中也能看到相当数量的岫玉籽料,大家要留意。
俄罗斯玉,近年来随着和田料的减少而逐渐成为软玉舞台的有力竞争者。
从玉材来看,俄料95%都是山料,但也有籽料,只是俄料中的“籽料”并未达到籽料定义的产状玉料:籽料由于长期的冲刷搬运碰撞,玉质形态韧性都达到了特别的质感,而俄料中的“籽料”其实没有这个长期的过程,严格意义上只能算和田玉的山流水料。
河磨料是国内确切命名的两种籽料之一,另一种是和田籽料。“河磨”,从河里磨出来的玉,名字起得很传神,可能因为河水的冲击力较小,河磨料多见厚皮料。
另外,近几年贵州罗甸也出产白度尚可的软玉,透闪石含量达95%,也是广义和田玉中的一种。罗甸玉石性很重,料子干涩,缺乏油性,其实所谓的“籽料”也只能用来骗骗小白玩友;广西大化玉则是这几年才出现的玉种,也是广义和田玉中的一种,大化玉里有籽料,质地也很细腻,有兴趣的宝友可以玩一玩。
适用版本信息说明
- filebeat 7
- elasticsearch 7
filebeat 7.5.2 上传数据到 Elasticsearch 报错:
journalctl -f -u filebeat |
此错误原因是由于 Elasticsearch 的集群中打开的分片数量超过了集群的最大分片限制。在 Elasticsearch 中,每个索引由多个分片组成,而集群有一个设置的最大分片数限制。这个限制是为了防止分片数过多导致性能问题。
错误消息 {"type":"illegal_argument_exception","reason":"Validation Failed: 1: this action would add [2] total shards, but this cluster currently has [6924]/[3000] maximum shards open;"} 显示当前集群已有 6924 个分片,超过了 3000 个的限制。
要解决这个问题,可以考虑以下几个选项:
调整 Elasticsearch 集群设置,增加最大分片数限制
可以通过更改 Elasticsearch 配置来增加最大分片数的限制。但请注意,这可能会导致性能问题,尤其是如果硬件资源有限的话。
这可以通过修改 cluster.max_shards_per_node 设置来实现
PUT /_cluster/settings |
获取 Elasticsearch 集群的最大分片数限制
curl -X GET "http://[your_elasticsearch_host]:9200/_cluster/settings?include_defaults=true&pretty" |
删除一些不必要的索引 :如果有些索引不再需要,可以删除它们来减少分片数。
curl -X DELETE "localhost:9200/my_index" |
合并一些小索引:如果有很多小的索引,可以考虑将它们合并为更大的索引,以减少总分片数。
优化现有索引的分片策略:可以优化索引的分片数量,例如,通过减少每个索引的主分片数量。
适用版本信息说明
- filebeat 7
- elasticsearch 7
使用以下 filebeat 配置文件
filebeat.inputs: |
filebeat 启动后报错,elasticsearch 上未创建相应的索引,关键错误信息 Failed to connect to backoff(elasticsearch(http://1.57.115.214:9200)): Connection marked as failed because the onConnect callback failed: resource 'filebeat-7.5.2' exists, but it is not an alias
journalctl -f -u filebeat |
这表明 Filebeat 无法正常连接到 Elasticsearch 集群。出现这个问题的主要原因可能为:
索引/别名冲突: Filebeat 试图创建或使用一个名为 filebeat-7.5.2 的索引或别名,但这个资源在 Elasticsearch 中已存在且不是一个别名。解决方法为 删除或重命名冲突索引
ILM 配置问题
使用此配置文件,解决 索引/别名冲突 问题后,filebeat 运行正常,但是 Elasticsearch 上未创建配置中的索引 logstash-admin-*,而是将数据上传到了索引 filebeat-7.5.2-*。这个问题是由 ILM 导致,可以禁用 ILM。参考以下配置,禁用 ILM (setup.ilm.enabled: false)
filebeat.inputs: |
常见选项
| 选项 | 说明 | 示例 |
|---|---|---|
-v |
输出详细信息 | |
-0 |
内容输出到指定文件或设备 | curl -o /dev/null |
-s |
不输出任何信息(http 响应内容除外) | |
-w |
自定义输出内容 | curl -s -o /dev/null -w %{http_code} https://csms.tech |
-I |
只获取响应头部信息 | curl -I https://csms.tech |
--resolve yourdomain.com:443:source_ip |
将 domain:port 解析为指定的 IP |
使用方法参考curl -v -H "Host: admin.test.com" --resolve admin.test.com:443:52.52.2.9 https://admin.test.com |
-H, --header |
自定义 http 请求头部 | -H "Host: admin.test.com" |
Dockerfile 是一个文本文件,其内包含了一条条的 指令(Instruction),每一条指令构建一层,因此每一条指令的内容,就是描述该层应当如何构建。
yum install -y nc |
Windows 下需要 下载 netcat 运行程序
下载后直接解压,将 nc.exe 复制到 C:\Windows\System32 目录或将 nc.exe 添加到系统 path 环境变量中
| 选项 | 说明 | 示例 |
|---|---|---|
-v -vvv |
打印详细信息 | |
-t |
使用 TCP 协议,默认为 TCP 协议 | |
-u |
使用 UDP 协议,默认为 TCP 协议 | |
-z |
不发送数据,效果为立即关闭连接,快速得出测试结果 |
注意事项:客户端测试使用
localhost作为主机名时,会优先被解析为 IPv6 地址,如果端口监听在 IPv4 地址,会导致测试结果不可达
以下输出表示端口可达
nc -vuz ip/domain 8472 |
以下输出表示端口不可达
nc -vuz 127.0.0.1 8473 |
prometheuskubectl create namespace prometheus |
Prometheus 使用 Kubernetes API 从 Nodes、Pods、Deployments 等等中读取所有可用的指标。因此,我们需要创建一个包含读取所需 API 组的 RBAC 策略,并将该策略绑定到新建的 prometheus 命名空间。[1]
prometheusClusterRole.yaml的文件,并复制以下 RBAC 角色。在下面给出的角色中,可以看到,我们已经往
nodes,services endpoints,pods和ingresses中添加了get,list以及watch权限。角色绑定被绑定到监控命名空间。如果有任何要从其他对象中检索指标的用例,则需要将其添加到此集群角色中。
apiVersion: rbac.authorization.k8s.io/v1 |
kubectl apply -f prometheusClusterRole.yaml |
要将 Python 脚本打包为 Windows 可运行程序,一种常用的方法是使用 PyInstaller。
pip install pyinstaller |
在命令行中,导航到脚本所在的文件夹并运行以下命令
pyinstaller --onefile test_file.py |
这会生成一个 dist 目录,里面包含一个名为 test_file.exe 的可执行文件。参数 --onefile 确保所有必要的文件都被包含在单一的可执行文件中。
以上方法打包后的文件点击运行后,桌面会弹窗一个 cmd 窗口,如果关闭了此 cmd 窗口,与其关联的程序也会被关闭。为了阻止这个命令行窗口的出现,并让程序在关闭窗口后仍然运行,你需要在使用 PyInstaller 打包时使用 --noconsole 选项。此外,为了使程序在没有任何可视窗口的情况下静默运行(例如,仅在系统托盘中),你还需要使用 --windowed 选项。
pyinstaller --onefile --noconsole --windowed test_file.py |
如果你想要程序在系统托盘中静默运行,并通过系统托盘图标进行交互,那么你需要使用其他库,如
pystray,来创建系统托盘应用。
添加最新版本,生产环境建议使用稳定版本
helm repo add rancher-latest https://releases.rancher.com/server-charts/latest |
你需要定义一个 Kubernetes 命名空间,用于安装由 Chart 创建的资源。这个命名空间的名称为 cattle-system:
kubectl create namespace cattle-system |
kubectl apply -f https://github.com/cert-manager/cert-manager/releases/download/v1.7.1/cert-manager.crds.yaml |
安装完 cert-manager 后,你可以通过检查 cert-manager 命名空间中正在运行的 Pod 来验证它是否已正确部署:
kubectl get pods -n cert-manager |
helm install rancher rancher-stable/rancher --namespace cattle-system \ |
安装成功后,输出结果如下
NAME: rancher |
根据提示,浏览器中访问 https://rancher.my.com/dashboard/?setup=admin,正常情况下,显示如下页面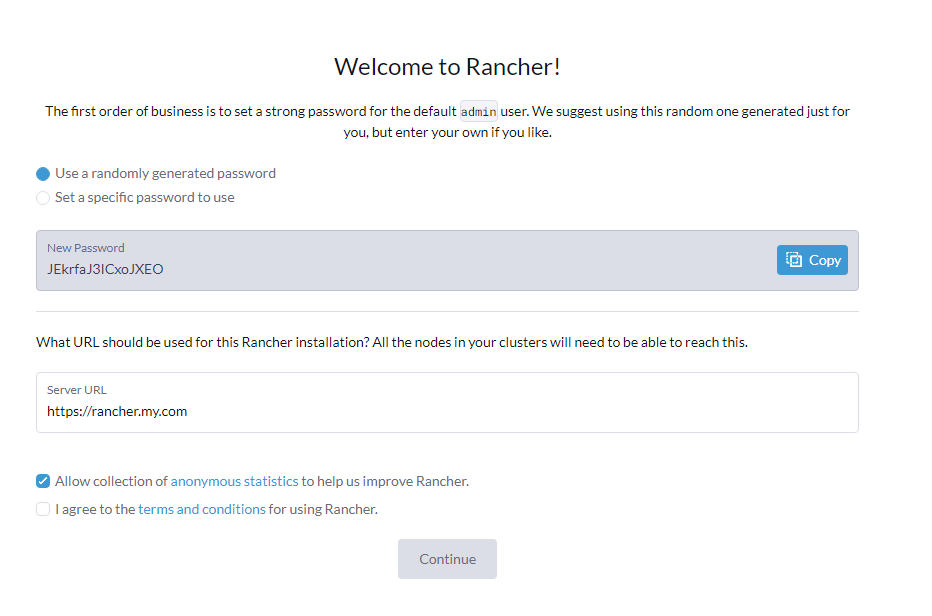
根据页面提示,保持密码,登陆。
blackbox_exporter 是一个由 Prometheus 社区维护的项目,它允许用户通过 HTTP、HTTPS、DNS、TCP 和 ICMP 协议对服务进行“黑盒”方式的探测,以检测和监控网络协议的可用性和响应时间。
本文档以在 Kubernetes 中部署 blackbox_exporter 为例,演示其使用方法。
为了能够监控到 Kubernetes 集群内部的部分信息(如 api-server 的证书等),建议 参考文档为其配置 RBAC 策略 以使其能读取 kube-apiserver 相关资源,本文档中的配置示例基于此权限配置。Namespace 为 prometheus
blackbox_export 基于配置文件运行,将其配置文件通过 Kubernetes 的 ConfiMap 存储,分离运行环境和配置,方便管理。
参考以下配置,创建 ConfigMap
apiVersion: v1 |
参考以下内容,创建 Deployment 和 Service,在此配置中,使用上面创建的 ConfigMap 作为 blackbox_export 的配置文件
apiVersion: apps/v1 |
部署成功后,从 prometheus 的 Namespace 中测试访问 blackbox_export 的 Endpoint blackbox-service:9115,如果是在其他 Namespace,可以使用 Endpoint blackbox-service.prometheus.svc.cluster.local:9115。如果集群的域名不是 cluster.local,修改为实际值。
|
在 Prometheus 配置中添加以下内容,使 Prometheus 抓取 black_exporter 的监控数据
- job_name: 'blackbox_http_2xx' |
部署完成后,观察过 Prometheus 的 Target,正常情况下可以看到监控目标的状态。
在 SUSE Linux(无论是 openSUSE 还是 SUSE Linux Enterprise Server)中,可以使用 zypper 命令行工具来管理和安装软件包。
在安装任何新的软件包之前,建议首先更新你的软件包数据库,以确保你拥有最新的软件包信息。
sudo zypper refresh |
如果你不确定软件包的确切名称,可以使用 zypper search 来查找它
zypper search <package-name> |
sudo zypper install <package-name> |
要查看关于特定软件包的详细信息,包括描述、版本和依赖关系等,可以使用
zypper info <package-name> |
sudo zypper remove <package-name> |
要升级所有已安装的软件包到其最新版本,可以使用以下命令
sudo zypper update |
以下示例安装常用工具包
net-tools,提供 netstat 命令iproute2 提供 ip、ss 等命令iputils 提供 ping 命令sudo zypper refresh |
通过华为云提供的 Python SDK 获取云服务器实例信息 [1]
>> from huaweicloudsdkcore.auth.credentials import BasicCredentials |
response 返回一个 huaweicloudsdkecs.v2.model.list_servers_details_response.ListServersDetailsResponse 对象,其中包含了服务器数量和服务器详情列表,要转换为 Python 字典对象,可以通过以下方法
>> import json |
根据云服务器 id,查询云服务器挂载的磁盘信息 [2]
>> request = ListServerBlockDevicesRequest(server_id='a7dd4502-cb3e-4754-b7b7-73bcb5696a1c') |
Akamai CDN API 说明文档,调用 API 之前需要先根据官方文档说明 Create API Client
根据官方文档说明安装 edgegrid-python,并配置 Create API Client Key 信息 [1]。
pip install edgegrid-python |
大多数 API 使用都需要提供 groupId,accountId,contractIds,通过以下接口获取这些信息 [2]
>> import requests |
如果
Property中存在分组,每个分组都有一个独立的groupId
查看最后一次(上次)系统启动的时间
who -b |
查看最后一次(上次)系统启动的时间,及运行级别
who -r |
通过查看 reboot 用户的登陆记录,可以知道系统的启动时间
last reboot |
文件太大,需要分割时,可以使用以下命令
split -b 100M -d test.file |
| 选项 | 说明 | 示例 |
|---|---|---|
-b, --bytes=SIZE |
按照指定大小分割文件 | |
-d, --numeric-suffixes |
指定分割后的文件后缀为数字 | |
-a, --suffix-length=N |
分割后的文件后缀的长度 |
split -b 100M -d test.file |
wget https://nodejs.org/dist/latest/node-v15.12.0-linux-x64.tar.gz |
安装pm2
npm install pm2 -g |
npm install pm2 |
安装指定版本的包
npm install -g [email protected] |
以 hexo 安装包为例,以下命令查看 hexo 安装包有哪些可选版本
npm show hexo versions |
以下命令可显示安装的包及它们的版本
npm ls |
如果要查看全局类型的包,使用 -g 选项
npm ls -g |
npm uninstall package_name |
卸载全局安装的包
npm uninstall package_name -g |
WARN EACCES user “root” does not have permission to access the dev dir “/root/.node-gyp/11.15.0”
ERR! stack Error: EACCES: permission denied, mkdir ‘node_modules/sqlite3/.node-gyp’
[解决方法]:
npm install --unsafe-perm |
Centos7
Python3
wcs-python3-sdk (5.0.35)
网宿云 python sdk 安装命令 pip3 install wcs-python3-sdk, 安装后包含 cli 工具 wcscmd
wcscmd --configure [--config=FILE] |
--config=FILE 配置文件存储路径,默认~/.wcscfg [1]
wcscmd listbucket |
以下命令列出所有文件列表,并写入文件中
wcscmd listall wcs://BUCKET ./temp/f |
from wcs.commons.config import Config |
将源站的内容主动预取到 CDN 节点,用户首次访问可直接命中缓存,即提升首次访问速度,又能有效缓解源站压力。
ansible playbook 使用的是 YAML 格式的语法。
--- |
playbook 由一个或多个 play 组成。它的内容是一个以 play 为元素的列表。以上示例仅包含一个 play
在需要免密码登陆的场景下,可以配置 ssh 密钥登陆。配置步骤如下
ssh-keygen |
/home/testuser/.ssh/id_rsa.pub 和 /home/testuser/.ssh/id_rsa 中。/home/testuser/.ssh/authorized_keys。或者手动拷贝公钥追加到目标主机的 .ssh/authorized_keys ssh-copy-id -p 30000 [email protected] |
如果要配置双向免密,将以上步骤反过来操作一遍即可
登录服务器,经常遇见以下提示信息,说明有主机一直在尝试暴力破解用户名密码
There were 696 failed login attempts since the last successful login. |
查看登录失败的用户名和 ip 地址
grep "Failed password for invalid user " /var/log/secure | awk '{print $11,$13}' | sort | uniq -c | sort -k1 -n |